Desert Online General Trading LLC
Dubai, United Arab Emirates
Desert Online General Trading LLC
Dubai, United Arab Emirates


Full description not available
E**R
Insightful, practical, and colorful. Perspective from a biased reviewer.
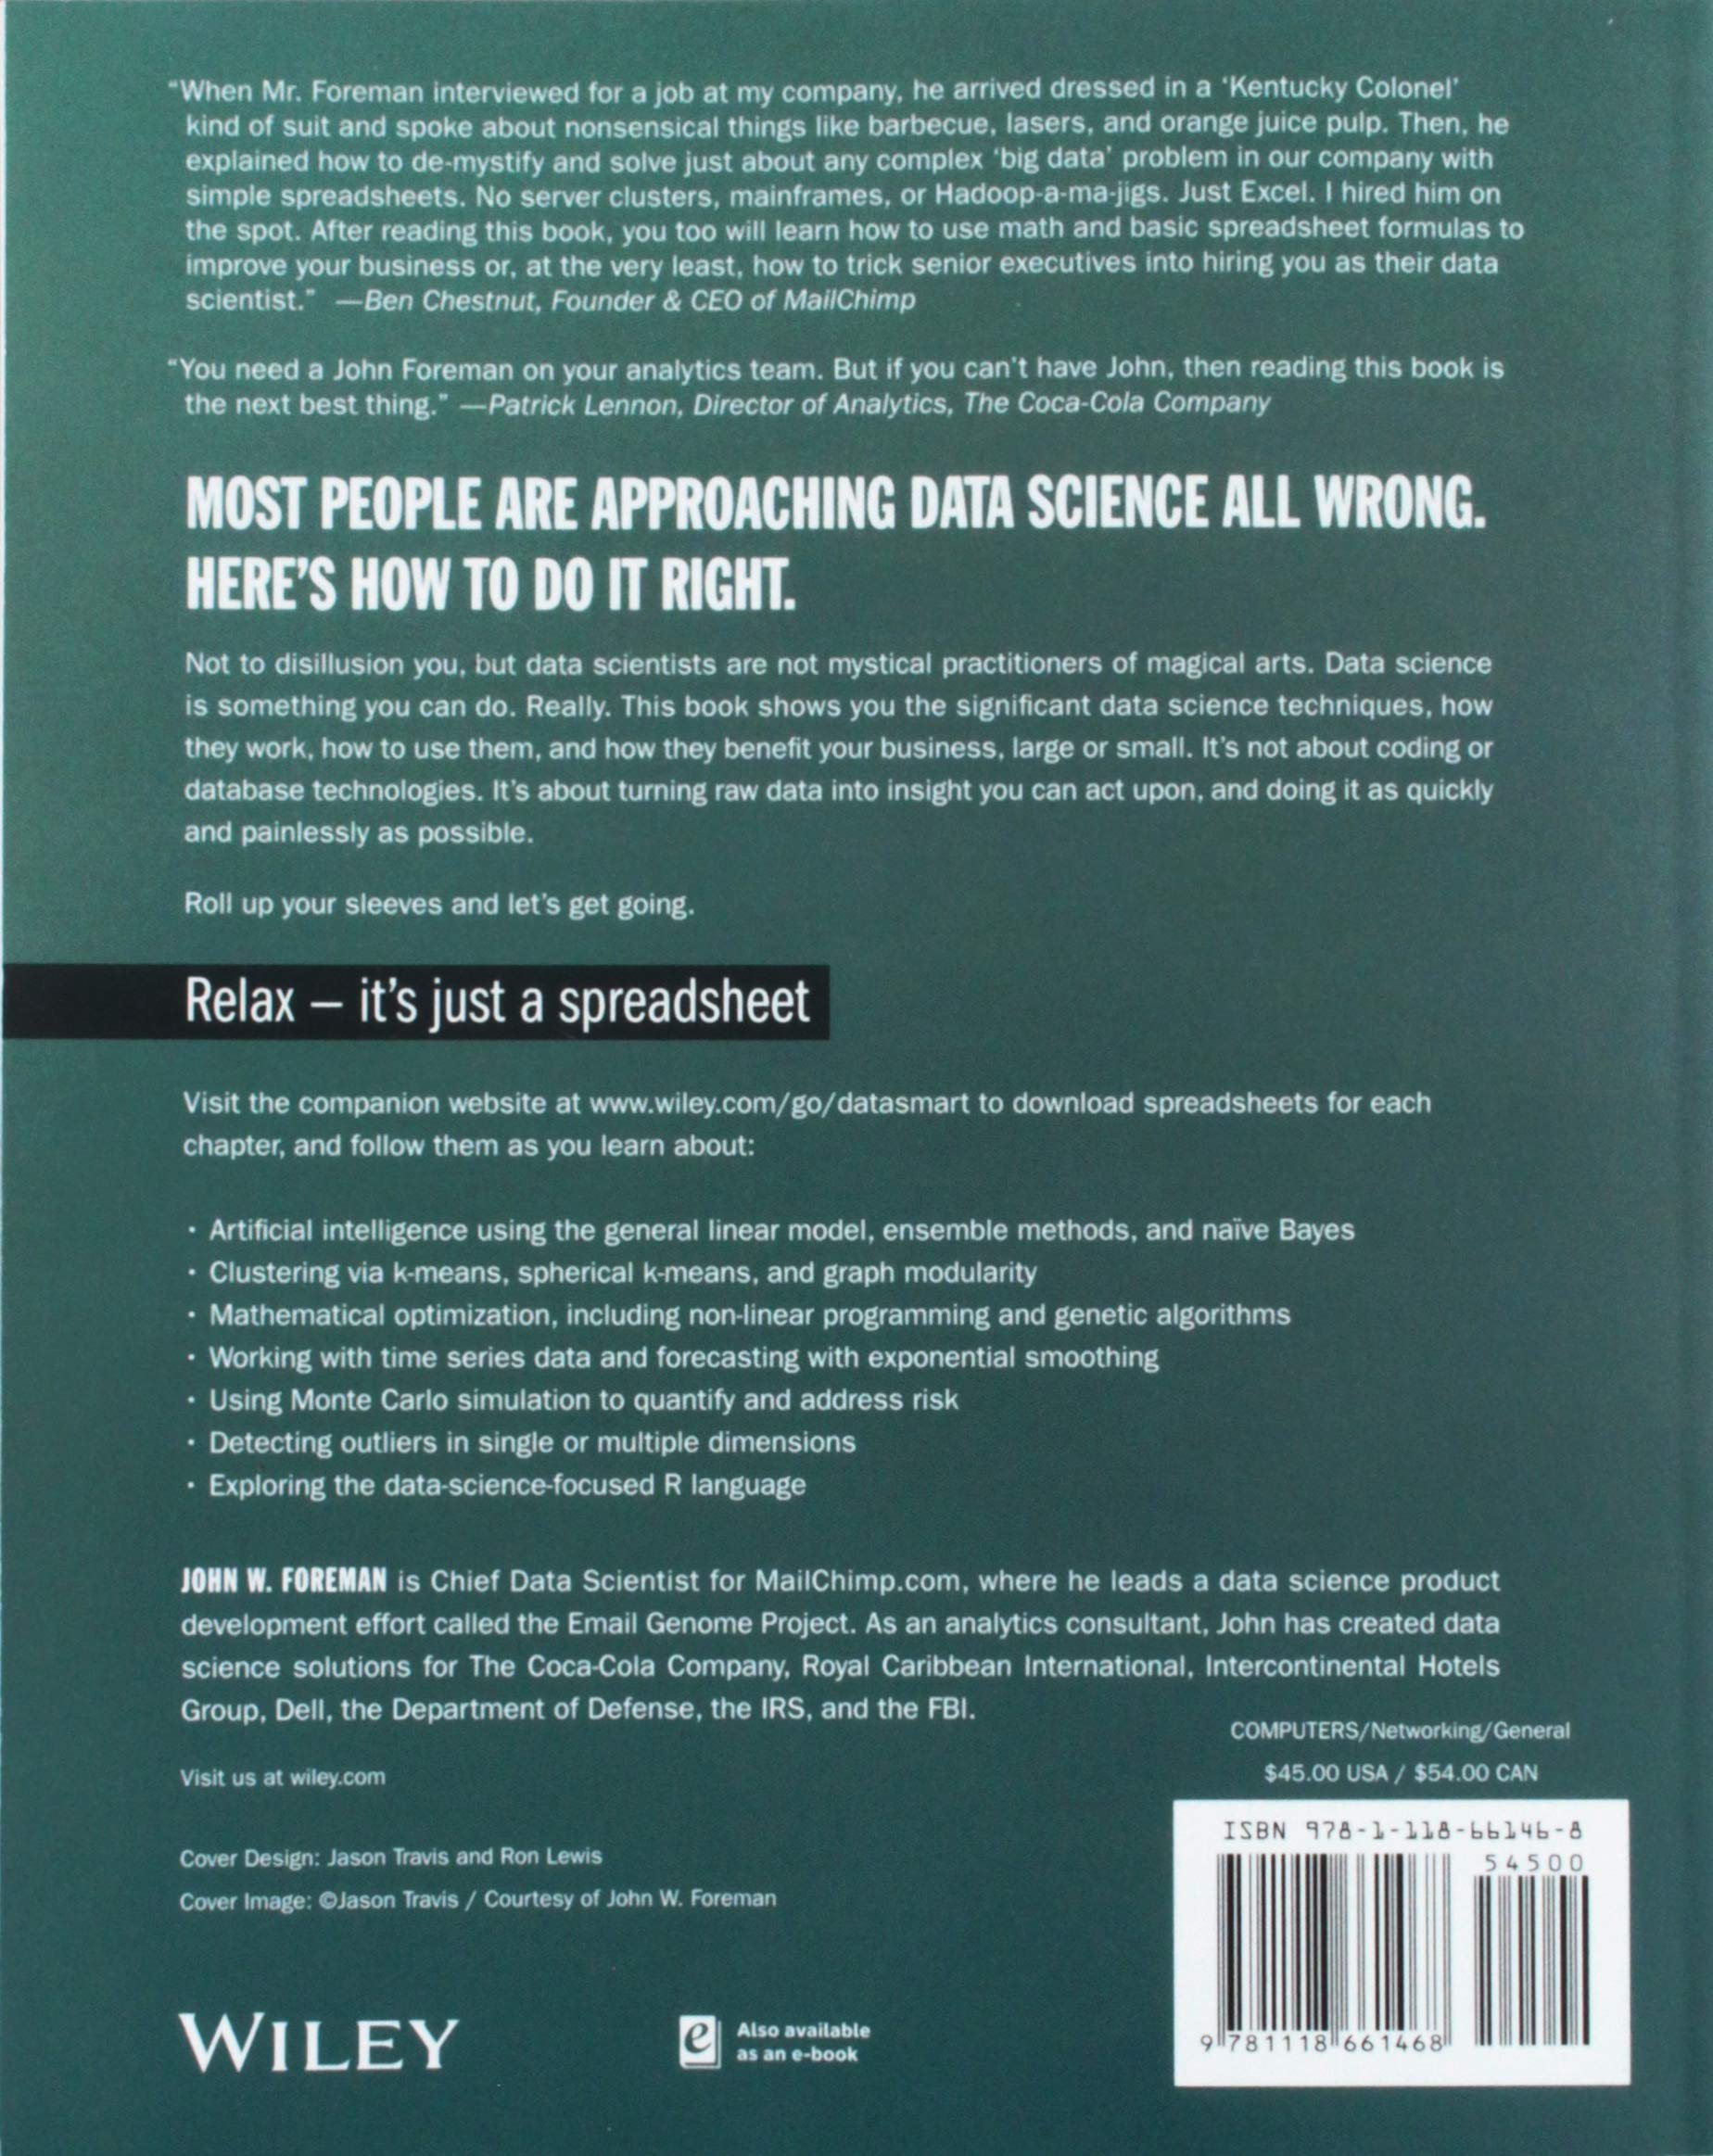
Disclaimer: I served as a paid technical editor for Data Smart. I am not affiliated with the publisher, but I did receive a small fee for double-checking the book's mathematical content before it went to press. I also went to elementary school with the author. So as you read the rest of the review, keep in mind that this reviewer's judgment could be clouded by my lifelong allegiance to Lookout Mountain Elementary School, as well as the Scarface-esque pile of one dollar bills currently sitting on my kitchen table.Anyway, books about "Data" seem to fit into one of the following categories:* Extremely technical gradate-level mathematics books with lots of Greek letters and summation signs* Pie-in-the-sky business bestsellers about how "Data" is going to revolutionize the world as we know it. (I call these "Moneyball" books)* Technical books about the hottest new "Big Data" technology such as R and HadoopData Smart is none of these. Unlike "Moneyball" books, Data Smart contains enough practical information to actually start performing analyses. Unlike most textbooks, it doesn't get bogged down in mathematical notation. And unlike books about R or the distributed data blah-blah du jour, all the examples use good old Microsoft Excel. It's geared toward competent analysts who are comfortable with Excel and aren't afraid of thinking about problems in a mathematical way. It's goal isn't to "revolutionize" your business with million-dollar software, but rather to make incremental improvements to processes with accessible analytic techniques.I don't work at a big company, so I can't attest to the number of dollars your company will save by applying the book's methods. But I can attest that the author makes difficult mathematical concepts accessible with his quirky sense of humor and gift for metaphor. For example, I previously had not been exposed to the nitty-gritty of clustering techniques. After a couple of hours with the clustering chapters, which include illuminating diagrams and spreadsheet formulas, I felt like I had a good handle on the concepts, and would feel comfortable implementing the ideas in Excel -- or any other language, for that matter.What I like most about the book is that it doesn't try to wave a magic data wand to cure all of your company's ills. Instead it focuses on a few areas where data and analytic techniques can deliver a concrete benefit, and gives you just enough to get started. In particular:* Optimization techniques (Ch. 4) can systematically reduce the cost of manufacturing inputs* Clustering techniques (Ch. 2 and 5) can deliver insights into customer behavior* Predictive techniques (Ch. 3, 6, and 7) can increase margins with better predictions of uncertain outcomes* Forecasting techniques (Ch. 8) can reduce waste with better demand planningIt may take some creativity to figure out how to apply the methods to your own business processes, but all of the techniques are "tried and true" in the sense of being widely deployed at large companies with big analytics budgets and teams of Ph.D.'s on staff. This book's contribution is to make these techniques available to anyone with a little background in applied mathematics and a copy of Excel. For that reason, despite the absence of glitter and/or Jack Welch on the book's cover, I think Data Smart is an important business book.I had a few criticisms of the book as I was reading drafts, but almost all of them were addressed before the final revision. For the sake of completeness, I'll tell you what they were. Some of the chapters ran on a bit long, but these have been split up into manageable pieces. The Optimization chapter is a bit of a doozie, and used to be at the very beginning, but the reader can now "warm up" with some easier chapters on clustering and simple Bayesian techniques. The Regression chapter originally didn't discuss Receiver Operating Characteristic curves, which are important for evaluating predictive models visually, but now ROC curves are abundant.Only one real criticism from me remains: I would have liked to see more on quantile regression, which is only mentioned in passing. It's a great technique for dealing with outlier-heavy data. The book by Koenker has good but highly mathematical coverage, and I would have loved to see this subject given the Foreman treatment. But, you can't have everything, and I suppose John needs to leave some material for Data Smart 2: The Spreadsheet of Doom.In sum, Data Smart is a well-written and engaging guide to getting new insights from data using familiar tools. The techniques aren't really cutting-edge -- in fact, most have been around for decades -- but to my knowledge this is the first time they've been presented in a way that Excel-slinging business analysts can apply the methods without needing her own team of operations researchers and data scientists. If you're not sure whether the book's sophistication is on par with your own skills, you can download a complete sample chapter (as well as example spreadsheets) from the author's website.One last thing: unlike many books with a technical bent, the prose is engaging and extremely clear. I think this can be traced to John's childhood. When John misbehaved, his father (who is a professor of English) would punish John by forcing him to read a novel by Charles Dickens. Minor infractions resulted in A Christmas Carol being meted out, and when he was really bad he had to read Great Expectations. This is a true story which you should ask John about if you see him at a book-signing event.
K**R
Excellent - clear, involving and thorough - you will learn a lot - highly recommended
I highly recommend John Foreman's book: 'Data Smart - Using Data Science to Transform Data into Insight'. The author's approach is unique - he teaches data science skills without teaching programming. His approach works because he limits the newness of each subject item to one dimension, that being the data science technique at hand. Each skill is introduced in the familiar environment of Excel and its spreadsheets. If the author had introduced a programming language at the same time, the difficulty of staying focused on the technique being taught would have been increased greatly.Each technique introduced is explained by first posing and then working through a business problem. Each problem has an accompanying Excel dataset. For each challenge, you are soon immersed in data - your Excel skills will be stretched and improved and you will need to work hard to keep abreast of each lesson. It is worthwhile for the reader because tangible learning occurs as the data is worked through and the business challenges are demonstrably solved.The techniques you will learn include:Cluster analysis using k-means and k-medians algorithmsDocument classification using a Naive Bayes algorithmOptimization modeling using linear programming methodsCommunity detection in network graphs using modularity maximizationLinear and logistic regressionEnsemble models based on bagging and boosting techniquesForecasting based on exponential smoothing with trend and seasonality (ETS)Outlier detection using k-nearest-neighbors and local outlier factorsIn addition to teaching techniques, the author sprinkles the text with conclusions he has formed based on his years of data science practice and on a healthy skepticism for some of the overblown claims made for data science. His advice includes the following:Beware the poorly posed problem. Data scientists must learn to communicate with stakeholders in order to help frame business problems properly.You will generally get more benefit by spending time selecting good data and engineering better data features than searching for a marginally better predictive model. A great model cannot deliver good performance with poor data.Remember, industry is not academia. In industry, analytics is a results-driven pursuit. The best model is the one that strikes a balance between performance and usability. If a model is never used, it is worthless.Mailchimp, the author's employer, has TB of data under management. However, it neither needs nor uses all this data for analysis and model training. Instead it aggregates its data to the level the business requires. This aggregate dataset is typically 10GB in size. This aggregation enables mailchimp to use R in production.Data science is not the most important function in the organization. The purpose of the data science function is to serve the business and help it achieve its goals. The purpose of data science is not to build models for their own sake.The author introduces the R programming language in the final chapter, as a gateway to doing further work in data science. R is very powerful but it can appear to be a black-box tool for solving data analysis problems. As the author explains, R has great performance but it is not great for explaining the inner workings of models.At the outset, the author explained that he preferred clarity over mathematical correctness when writing the book. He did an excellent job. The aspiring data scientist will learn by doing in the familiar and manageable environment of Excel.
Trustpilot
2 months ago
2 weeks ago